The Bull Market in Stocks is Back!

I have got pretty tragic news on 10th April 2020.
There’s been the death with someone that we all know really well. And it is the death of the bear.
The bear market is officially dead. But the good news is the bull market is back. So let’s take a look at a glance to really understand what’s going on.
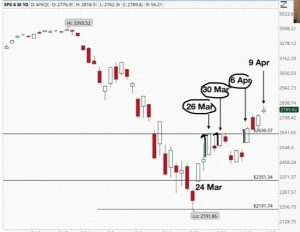
Here we have the S&P 500 index.
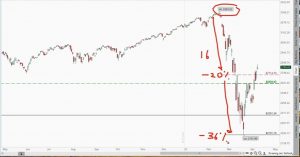
A bear market is defined as a drop of 20% or more from the high of the market.
The high of the market at the beginning of the year was $3393 and we dropped into a bear market at the 20% mark and this took 16 days. It was the fastest in history for the bull market to turn into a bear market and it actually went all the way down to a low of $2191, a 36% decline from the high.
As I mentioned before, if you look at all the bear markets in the last 100 years, the average decline of the 21 bear markets in the last hundred years was actually -36% so it was pretty coincidental.

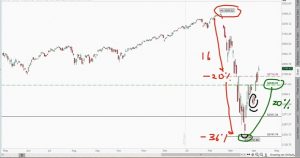
Now a bull market is defined as a rise of 20% from the low of the market.
A 20% increase from the low of $2191 is $2630 and you can see that the market has just crossed that level, which officially means a bull market has begun and the entire bear market lasted only 19 days.
It was one of the fastest bear markets in the history of the world. In fact, I turned bullish on the markets way before that happened.
In fact, I went bullish on the markets and started to buy stocks and take on bullish trades over here on the 3rd of April.
Because I saw a bullish engulfing pattern making higher low from the previous low. So when I see higher lows and I see a bullish engulfing pattern, I turn bullish on the markets and I told my students I’m buying stocks right now.
Now many people were surprised that the bear market ended so fast and many wondered how could the bear market end when the economy still in tatters.
I was not surprised because if you are one of my students, you would have seen the signal that the market has actually hit a bear market bottom and I would like to share with you what are the signals that I look at. So for future bear markets, you can look at the signals yourself.
There are four things I’ve looked at for the last 20 years and they’ve proven very reliable even for today’s bear market.
Extreme Volatility and Extreme Oversold Conditions
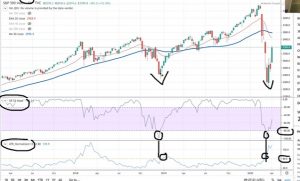
One of the most powerful signals that the bear market has bottomed is when I see extreme volatility and this is measured using ATR (average true range).
When you’ve got big ATRs. It signals a bear market bottom if it coincides with extreme oversold conditions.
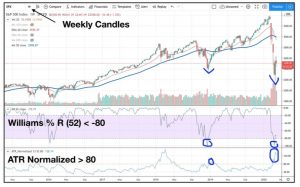
This signal has been accurate in the last 50 years. I looked the normalized ATR as well as the William’s % R that measures oversold conditions at the 52-week level.
When the ATR is above 80 and if the Williams R is below minus 80 with both happening at the same time, this is the signal of a market bottom.
Take a look at this example below:
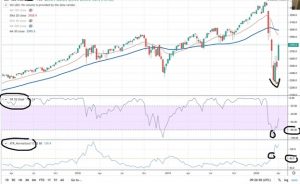
So you can see over here this ATR crosses above 80 and the Williams R goes below minus 80 and when they both happen, that signals the bottom over there. That’s how I could tell.
Last year we had the 2018 bottom. Same thing. Wiliam’s R minus 80 coinciding of ATR above 80 so whenever they got the two signals together, that’s the bottom.
Peak Levels of Unemployment
Now the second sign of a bear market bottom is when unemployment in the U.S hits peak levels. We’ve got massive unemployment people out of jobs and that’s the time the market is bottom and the time to buy stocks.
I know it sounds a bit counter-intuitive and people always think that they should buy stocks when things are going well but that’s wrong. The best time to buy is at the bottom and that’s when there’s massive unemployment.
Take a look at this chart:

The upward trending blue line represents the stock market and the black line that’s going up and down represents unemployment claims or jobless claim benefits.
Now check something out. Notice that when unemployment claims go up past the 450,000 mark (black dotted line), the stock market bottoms.
That’s when you buy to catch the next bull market.
It sounds weird, but that’s how it works.
So where are we now in terms of the unemployment claims in the market?
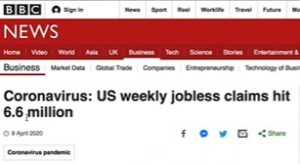
Currently, the U.S jobless claims have hit 6.6 million. This is terrible and really awful and I wish that it did not happen. But from an investing viewpoint, this is the time to buy stocks.
Whenever unemployment climbs really high, it marks the bottom of the bear market.
Now the next chart shows you the same thing.
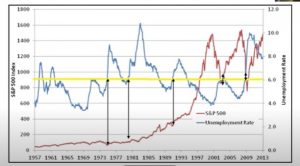
The red line represents the stock market and the blue line represents the unemployment rate.
Notice whenever the unemployment rate goes above 6%, the market bottoms and it’s time to buy stocks to catch the bull market.
Now, what’s the unemployment rate right now?

It is now at a whopping 14% in the U.S. This is the highest spike in unemployment that again reverses to mark the bottom of the stock market, which I know is counter-intuitive, but that’s how the market works.
Market Rallying on Bad News
The market bottoms when it starts rallying on bad news.
When you see a lot of bad news in the media but the market no longer goes down, it tells you that the market has bottomed because there are no more sellers left. Everyone who has needed to sell has already sold, and that’s a sign of capitulation.
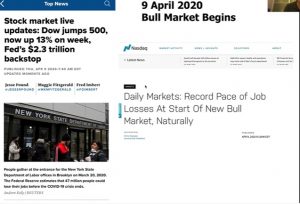
So, for example, they could look at this, this was back on 5th April and 6th April.
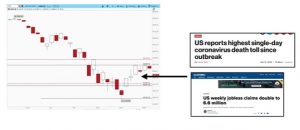
Look at the news in the media.
U.S reports highest single-day death since the outbreak but the market goes up.
U.S weekly jobless claims doubled to 6.6 million people and the market went up as well.
So when the market starts going up on bad news, it means it’s over. Nothing else can make the market go down because the worst news has been priced into the markets.
S&P 500 Dividend Yield Exceeds Bond Yields
Fourth condition I’m looking at is when the S&P 500 dividend yield exceeds the yield of the 30-year treasury bonds.
Historically, it is safer to buy government bonds because they should give you higher yields or interest as compared to the stock market (S&P 500). But whenever the S&P 500 gives you higher dividend yields compared to bond yields, that signals that the market has bottomed because stocks are cheaper than bonds.
Stocks are undervalued and bonds are overvalued and this triggers a flow of funds from big institutions, from bonds to stocks, hence creating the next bull market.
Take a look at this chart below.
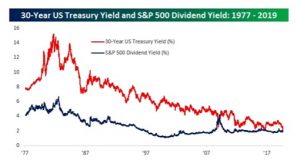
You can see from 1977 to 2019 there’s only been two times when the 30-year treasury yield (red line) has gone below the S&P 500 dividend yield. It happened at the bottom of the financial crisis that triggered the bull run after the financial crisis. And it also happened briefly when Brexit was announced and now it is happening again.
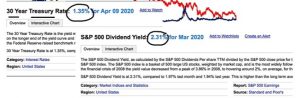
You can see right now that the U.S 30-year treasury rate is 1.35% so if you buy 30-year government bonds, you’re getting 1.35% return on your money. But the S&P 500 is offering a yield of 2.31%.
The S&P500 yield exceeds the bond yields and this signals that stocks are really cheap, they’re at the bottom and they’re triggering the next bull market.
Now, whenever I tell people that the stock market’s in a new bull market, a lot of people will say, that it’s not possible because the economy is in a recession or depression when there’s going to be more job and business losses. Things are going to get worse.
And I agree with that, but you must understand that the stock market is not the economy!
The stock market is a leading indicator of the economy and it moves 6-9 months ahead of the economy. The stock market doesn’t care what’s happening now or what’s happening next week or next month. The stock market cares what’s happening in 6-9 months. So even though we’re in a recession right now, the stock market is already pricing in the recovery.
Take a look at is really nice chart by Sam Stovall
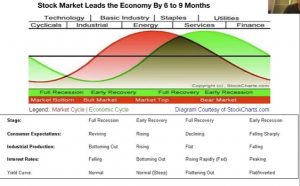
The red represents the stock market and the green represents the economy.
When the stock market is at the bottom, the economy is in a recession. So the time to buy stocks is during the bottom of the market and when the economy is in a recession!
But a lot of people think the opposite. They want to buy stocks when the economy is over and when the pandemic is over.
But when the economy recovers, you are buying at the top of the market. Retail investors tend to buy during this time and see their stocks going down after that. But professional investors buy when the economy is in the recession and at the market bottom to catch the best price and ride the bull market all the way up.
Now, if you take a look at the news headlines of the past week:
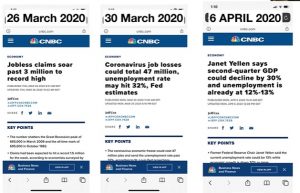
These are all very bad economic news.
A typical retail investor will sell their stocks when they see news like that but professional investors buy because it is a sign that the market has bottomed!
Let’s take a look at the charts during these dates:
The market went up on these dates!
This is because the stock market moves 6-9 months ahead of the economy.
So you can see when people are reading all the bad news and they’re selling, professional investors like me are buying like crazy. And that is the difference between a retail investor and a professional investor.
And sure enough, what happens after I buy?
The bull market started!
So this is why you should never make decisions based on reading the mainstream news blindly. Always take a look at the price action of the market and the intrinsic value of the stocks you buy.
An important disclaimer: just because we’re at a beginning of a new bull market doesn’t guarantee that we’re going to go all the way to the top right away because no one can predict how long this bull market is going to last.
Is it possible that the bear comes back for a rematch and we get another bear market really fast?
Sure. Anything’s possible.
That’s why as an investor, you always buy in stages and average into the markets. I never buy all at one time, I buy shares consistently. Even if the market goes down and becomes more undervalued again, I’ll just buy more shares because I know in the long run, if I buy great companies at huge discounts, it will always go higher.
And I’m certain in six months, in a year or two, our wealth will multiply many folds when we are following the principles of smart investing.


Leave a Reply
Want to join the discussion?Feel free to contribute!