The Bull Market in Stocks Continue! What’s Next? (Part 2 of 2)

This is part two of the bull market continues. If you haven’t read the first part of this post, click here to read it and come back to continue.
To find out where we’re going from here, let’s consult the charts and look the technicalities
Here, we’ve got the S&P 500.
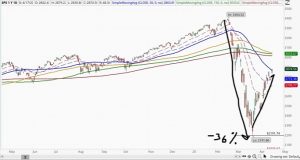
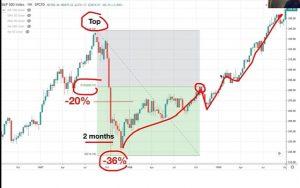
You can see that this is fastest bear market in history where we dropped 36% with the recent rally of the lows. Many people were expecting that the bear market would continue to go down but in a bear market or downtrend, the drop is not in a straight line.
You have got “impulsive wave down”, “corrective wave up”, and the next “impulsive wave down”. This corrective wave up is also known as a bear market rally or dead cat bounce.
When the market has an impulsive wave down, it will have a corrective wave up (usually a retracement of 38.2%, 50% or 61.8% – the Fibonacci retracement levels) before plunging further.
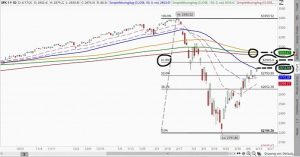
Let’s take a look at these levels:

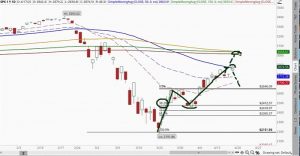
You can see the 38.2%, 50%, and 61.8% levels right here and these are strong resistance levels.
Initially, when the market was going up, people were expecting it to hit the 38.2% level and go down. It happened, it hit that level and came down, but it stopped there, forming a bullish engulfing pattern.
When a bullish engulfing pattern is formed, it starts making higher lows, and that was the clue that the bull market has begun especially in the face of bad news.
When you see a lot of bad news (deaths and recession) and the market doesn’t go down, it tells you that the bear market has died because bear markets don’t die on good news, they die on bad news and this tells you that there are no more sellers left. Everyone who have wanted to sell off in panic have already sold so the only people in the market left are the big institutional buyers and that was a clue that the market was bullish.
The market then continued going up and people were watching the 50% level and sure enough, it hit that resistance and it came down slightly, but it blasted back above that.

So, people expected 38.2% reversal, a 50% reversal and it didn’t happen. So what is the next level of resistance that we could potentially see a reversal down?
As you know, resistance can come in the form of moving averages or Fibonacci levels.
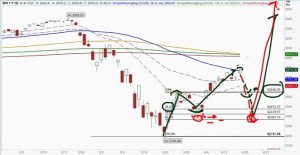
You can see the market as of Friday last week (13th April 2020), we were right at the 50 moving average blue line), and that could act as a resistance.
So, I’m not surprised that after this resistance, we could come down initially. Now, will we go all the way down or halfway down? I’ll talk about it in a short while.
But if it can break above the 50 moving average today, then the next resistance is the 61.8% level. So, I’m watching two levels over here. Tonight, I’m watching the $2874 point to see if it can break today’s resistance.
If it can break, the next resistance would be about $2935 because that is the 61.8% Fibonacci level that could act as a resistance. And if it can break above that level. The next level would be all the moving averages. So, you’ve got all these moving averages acting as strong resistance at the $3000 levels.

These are kind of like brick walls that the market has to punch through to get all the way back up there. Even if the market goes all the way back up, remember, it will not go up in a straight line. So, if you missed out on getting in at the lows, don’t worry! There’s still another chance for investors to get in!
As for me, I bought most of my stocks already and my shopping cart is full, so I’m not adding any more shares right now.
The reason why I am not adding any more shares right now is because of the wave patterns.
When it goes up, you get an impulsive wave up and it’s like breathing out, you can’t breathe out forever, you will run out off air. You have got to breathe in (corrective wave), breathe out (impulsive wave), breathe in (corrective wave), breathe out (impulsive wave).
So always remember the wave patterns as a smart trader or investor, you should always buy on the corrective wave. Never buy at the impulsive wave! The trouble with most retail investors is that they buy almost at the top of the impulsive wave because that’s where all the news is great.
When they see people making money, they get confident and jump in but once that happens, the market will drop and they will panic and sell. That’s why retail investors lose money.
So even though the stock market always goes up eventually, most people lose money because of the emotions. They buy high sell low.
So, to be a successful investor, you want to do the opposite of everyone else.
So professional investors don’t buy at the impulsive wave, they wait for the market to correct down and buy at the corrective wave. This happens when you hear bad news, but of course, you want to wait for it to come down to a level of support, like a Fibonacci level or a horizontal support level.
Depending on what kind of trader or investor you are, you can take profit at the impulsive wave up or hold it and let your wealth compound over the years.
It’s like in a relationship, never chase after the other party when they are running away, let them run to you and use this theory to apply to the stock market.
Right now, in the market, the other party is running away and this signifies our impulsive wave up.
Let’s take a look at the Fibonacci level. At 38.2% level, that’s where we hit the support and now it’s taken off all the way up. Do we want to chase after it? No!
I am currently waiting for it to come back down because the market is temporarily overbought. It’s like a rubber band that has been stretched, it’s got to snap back. Wait for the snapback to add shares!
We are now waiting for the resistance. This could be the resistance or it could still go up slightly too. So, you want to see a bearish candlestick pattern to signal a reversal.
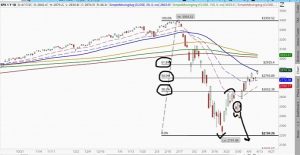
Once we get a reversal, we will see the market coming down and expect to see bad news in the market. But where will it find support?
We can’t predict the future but here are the levels that I am looking at.
The first level that I’m looking at is $2,646 to find a support.
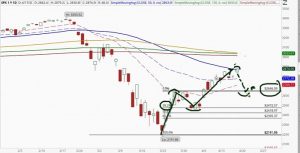
This is the previous resistance that could become support and if I see a reversal candlestick pattern, there I’ll start to add more shares or the market.
In fact, it could also come down to the previous low or go slightly below the previous low and reverse back up.
This is my stronger guess and we call this a force double bottom and it’s taught to me by a good friend, Alson Chew, who is a master of market manipulation because he was a professional prop trader for many years. He also studied how market makers manipulate the markets.
Market makers and brokers can see your stop loss! So, when people buy it at the bottom, they place their stop losses to protect them.
However, when these big institutional buyers and market makers want to buy shares, they want to buy cheap. So, they will find a way to short the market and release bad news, causing the market to go down to trigger these stop losses forcing the retail traders to sell their shares at a low price.
The market makers and the institutional buyers then buy the shares when retailers are selling and send it to the moon again!
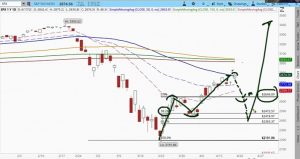
Hence, I am also watching this level at $2,365. If it hits this level, takes out the stop-losses and I see a reversal pattern (bullish engulfing pattern or bullish pin bar), I’m going to add more shares for the next ride up the bull market!
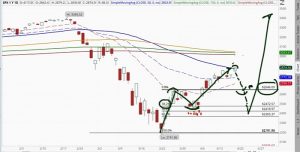
So to reiterate what I’m saying, the market is going to come down and it’s overbought. It’s going to come down but, in my opinion, (again, I can’t predict the future), it is unlikely that the market is going to make a lower low than before.

This is not a blind guess because for the last 100 years of bear markets, I have studied that every time the market recovers more than 55% of the bear market losses and it has never met a new low. It tends to make all-time highs instead. So, if the market does indeed make a new low, it will be the first time in a hundred years that it had happened.
Everything is possible, but it is unlikely for it to happen unless there’s a second big wave of viruses that hit the world, which could be a possibility. This is why we must always plan for eventualities no matter what happens.
Now for my guess, we are going to find support anywhere from $2,365 to $2,472 where we can add more shares and buy for the next leg up.
And my guess is by September or October this year, we should be at new highs in the market, or at least at a minimum at about $3,200 points.
Let me show you some of the historical facts for you to make your own decisions. Let’s take a look at all the bear markets since 1956. I can’t do anything before that because trading view does not have the data for me to look at.
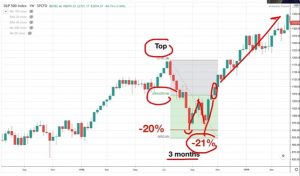
Bear Market 1956 – 1957
This is the S&P500 weekly candles.
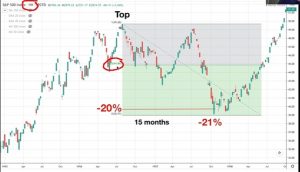
Pay attention to the green line, that is the 55% mark of recovery after the bear market losses. In history, every time the stock market is able to regain 55% of the bear market losses, it doesn’t make a new low. It tends to make new highs.
So let’s check this out.
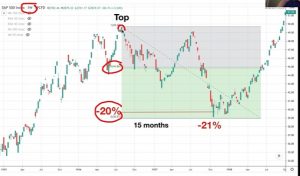
The red line represents the 20% drop from the high (bear market).
This becomes a bear market in 15 months with a 21% drop from the high and once it hit that low, it went up and crossed the 55%, it did not make a new low anymore, it made a new high.

Note that there MUST BE AT LEAST a 20% drop for this rule to hold!
Bear Market 1962
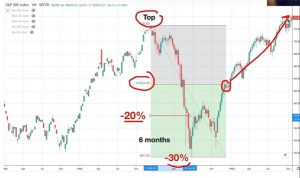
In 6 months, the market dropped to a bear market and continued all the way to a 30% drop. It went back up, came down and crossed the 55% mark and went all the way up and made new highs, never a new low.
Bear Market 1966
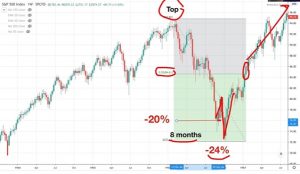
It took 8 months to drop 24% and notice that it rallied up but not to 55% then it dropped and as it passes the 55% mark, it went all the way up.
Bear Market 1968 – 1970
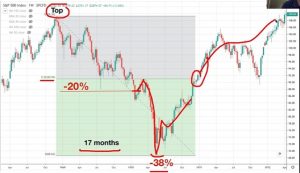
This was a 17 month long bear market. It took 17 months to bottom and hit 38%. Notice that after the 20% mark, it rallied but it did not reach the 55% mark and went back down to a new low before breaking the 55% mark?
Again, note that the stock market did not go up in a straight line, so remember that you will always have a chance to get back into the market during the corrective waves.
Bear Market 1973
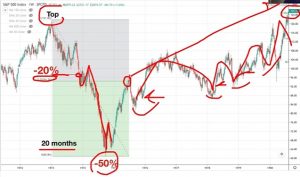
It took a total of 20 months to reach the bottom at -50%. Notice that when it was at 20%, it rallied, could not reach the 55% mark and went down all the way.
But once it closed above 55%, you can see that we made new highs eventually! Also, the market did not go up in a straight line, it went up and down. So you can expect more corrective waves and that’s when you want to buy, when there’s bad news.
Bear Market 1980
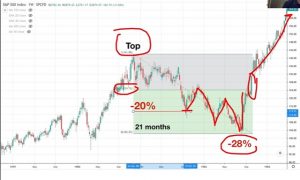
Went into a bear market after it dropped 20%, rallied up but did not close at 55% and went back down eventually bottomed at 28%.
You can see that after it hit the 55% mark, it made greater highs.
Bear Market 1987
This was the Black Monday crash featured on the Wolf of wall street.
It took 2 months to bottom at 36% and it proceeded to close above the 55% mark. Once it closed, it went down again and went back up all the way.
This is very similar to the current market, so I am waiting for the current market to go down again before buying more to catch the next wave up.
Bear Market 1990 – 1991
This was exactly a 20% drop. Took three months and closed above 55% mark and went all the way straight up.
Bear Market 1998
This bear market dropped 21% and when it reached its first low, it rallied back up and could not recover 55%. So it came back down, rallied back up to close above 55% and created higher highs.
Bear Market 2000
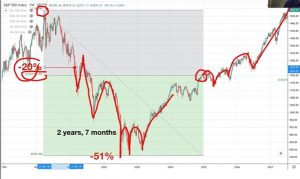
In 2000, once we hit the bear market, it rallied back up but did not close at 55%, dropped back down again and bottomed at -51% in 2 years 7 months.
It took the market quite a while to close at 55% and once it did, the market made corrections before creating higher highs.
Bear Market 2007-2009
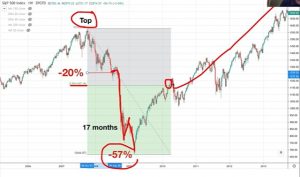
This was the financial crisis where I wrote the book Profit From The Panic.
We entered a bear market, it dropped and recovered but could not reach 55%, made another low and it totaled up to a 57% bear market. Since we hit that low, we recovered 55% and we made higher highs.
Again, it did not go up in a straight line. It retraced back down.

And when this happens, it scared the retail investors to sell and that’s when professional investors buy! When the market is rising up again, they start to buy in and when the bad news comes, they panic and they sell.
So notice that every time the retail investors sell, the professional investors buy in.
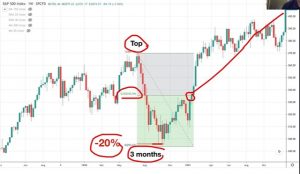
Bear Market 2018

This was a very short bear market, only three months.
It went all the way down to exactly 20%, recovered at the 55% mark and went up all the way.
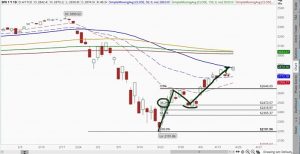
Present Bear Market
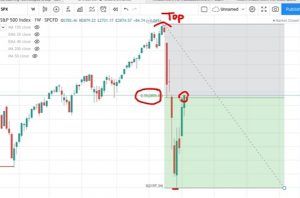
I’m looking at the S&P500 weekly candles. We are down 36% and using my Fibonacci tool, you can see that last Friday, we manage to close above the 55% mark.

So based on history, the probability is that we are not going to make a new low and we are going to go up from here. But remember, it does not go up in a straight line. We are likely going to go up, come down a little, go up, come down a little before we make newer highs.
This is how I read the markets and again, I am not a financial advisor and this is not financial advice. I’m purely sharing this for educational and entertainment purposes only and how I build my fortune in the markets every time after a bear market. But you’ve got to make your own decisions and have your own strategy.


Leave a Reply
Want to join the discussion?Feel free to contribute!