5 Costly Mistakes That Investors Make (Part 1)

In this post, I’ll be talking about the 5 costly mistakes that most retail investors make that’s costing them millions of dollars of potentially lost profits.
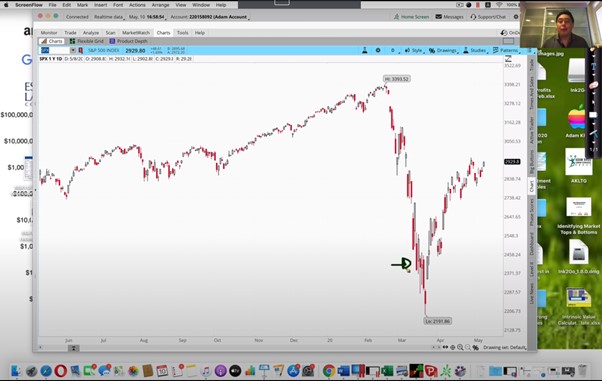
But before that, let’s do a quick review on what’s happening in the markets. If you’ve been following me on YouTube, you will know that I caught the potential bottom of the bear market and the start of the bull market.
And since then, as you can see, the S&P 500 is up about 33% from that and it’s been really profitable for those of us who have been buying stocks in the last one month.

One of my personal portfolios is also up over a quarter million dollars just in the last 30 days. And you can see that all the stocks that I have are now showing profits since I entered them about a month or so ago. And it’s also really great to know that all my students who have been following me on my private community, my telegram check groups have also been doing really well.
Now the sad thing is that many retail investors may have missed out on this fantastic rally last 30 days.
Why? Because many retail investors would have sold somewhere here for the fear that it is going to go lower.
They are reading all these negative news headlines!
“The depression is coming”
“The market’s going to crash as bad as the financial crisis”
The moment they sell, the stock goes back up and they don’t buy it back straight away because they are afraid that there’s going to be another crash! Every time they say they will buy it back when the stock gets lower, it goes up higher and it keeps going up!
Next thing you know, the market is up 300% and they’re left behind again.
As a retail investor, you can make tremendous profits investing in a stock market and watch your wealth compound over time.
The reason most people don’t achieve that is because they keep making the five costly mistakes. Once you understand these mistakes and you rectify them, you can turn around your financial future.
So let’s run through these mistakes right now.
Mistake #1: Selling Stocks When a Recession Starts
When a recession starts, stock investors anticipate where the stock market is going to go by watching the economic news. And you shouldn’t do that.
Because always remember this, the stock market is not the economy. They are two totally different things.
The stock market is a leading indicator of the economy. The stock market doesn’t care what the economy is doing now, or next week or next month, the stock market always anticipates what’s going to happen in the future.
So take a look at this chart
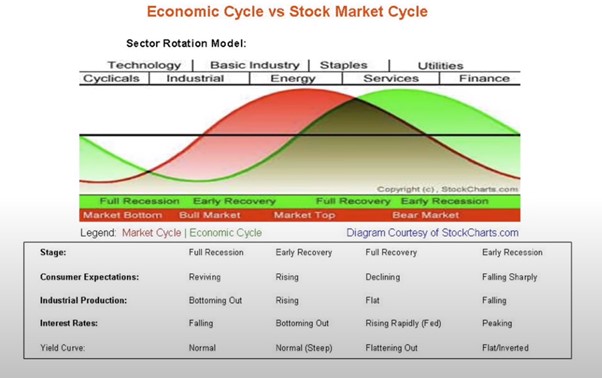
This red line represents the stock market cycle and the green line represents economy.
As an investor, you obviously want to buy at the market bottom and sell at the market top, am I right? But notice something interesting, when the market is at the bottom, the economy line is going into a recession.
The right time to buy stocks is at a market bottom!
You don’t sell stocks when the economy is going into a recession, you buy them and when the recession starts and gets into a full recession, you buy even more.
But the trouble with most investors is that they do the opposite.
What do they do?
They sell when the recession starts and that’s where they are selling low. These investors then buy when the economy is doing well and that’s when they are buying at the market top.
This is why they always lose money.
Well, let’s watch this theory play out in real life.
These are some of the economic news in 2020:
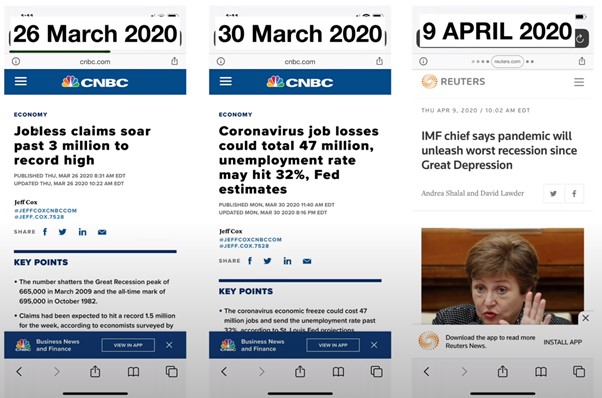
All these news told us that the economy was in big trouble.
Now, most retail investors sold their stocks during this period of time but as a smart investor, you should buy stocks when you see negative economic news, because it means that the market has bottomed.
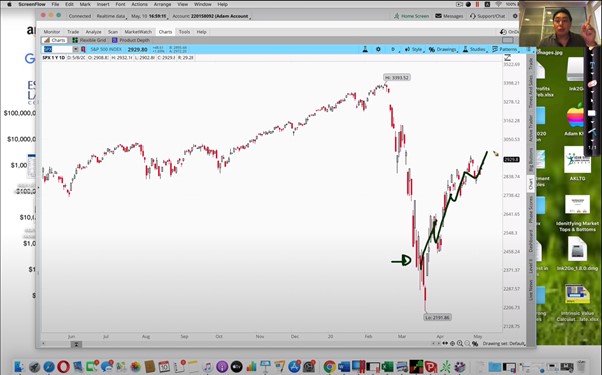
Now, take a look at these charts:
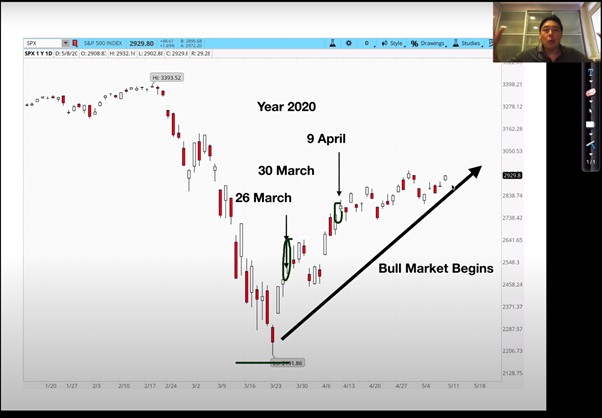
I was buying stocks with all of my students when retail investors were selling them.
You want to do the opposite of what everyone else does.
Here’s another example of how the stock market is not the economy:
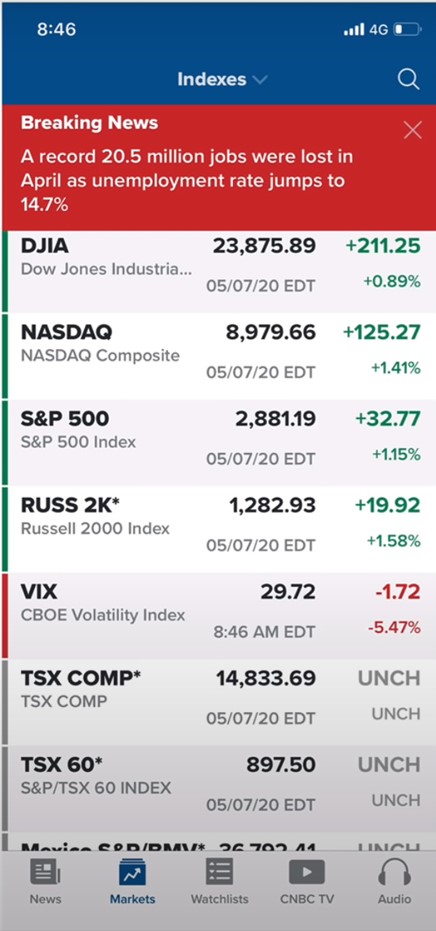
When there was a record 20 million job losses with unemployment rate jumping to 14%, what happens to the market? The market rallied strongly on this day!
I’ve been investing in the markets for 27 years and I’ve been through 7 bear markets. Let me tell you something, the plot is always the same.
Let me show you the last time this happened:
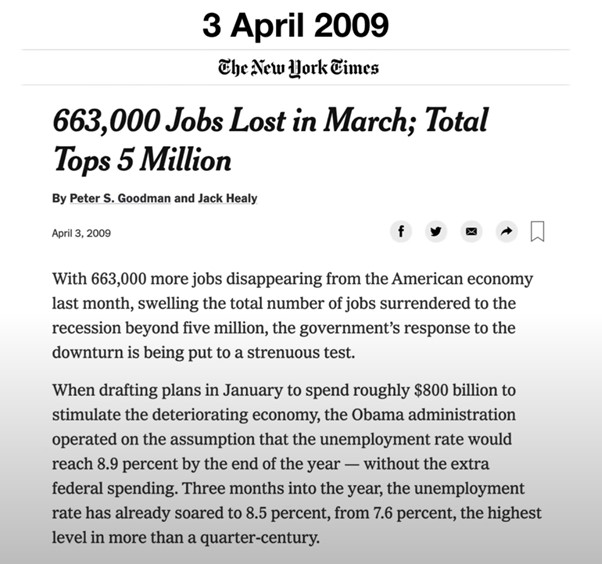

Most retail investors sell their stocks when they read these news article, but what should you do?
Let’s see what would have happened if you bought it on the 8th of May and on the 3rd of April?
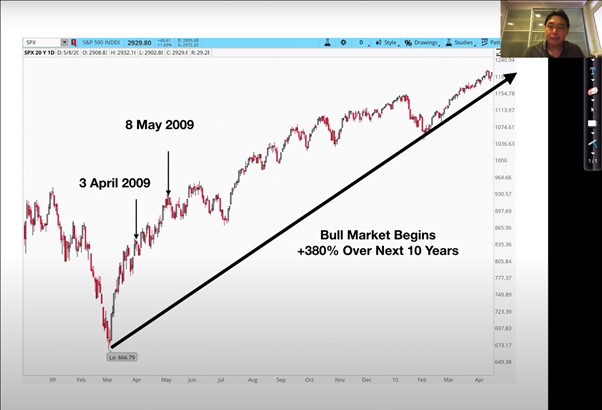
You would have caught the strongest bull market in history. From there, the market went up 380% over the next 10 years.
Let’s go back even further:
Here are some news headlines in 2002-2003:
U.S retail sales fell 1.2% in September; More indications of a slowing economy, 12 October 2002.
Fed gets gloomy on the state of the economy; Activity sluggish,survey discovers. 24 October 2002.
A Dismal 2002 ends quietly on Wall Street, Dow’s percentage loss bigger since 1977. 1 January 2003.
Dow retreats below 8,000 points; War, other fears spur “Bearish Sentiment”. 28 January 2003.
What should we do? Buy or sell?
When you look at negative headlines, you buy! So what happens after this?
2 months later, the market started a bull run for four straight years and gained 86%!
Another example in 1974:
News headlines in 1974:
Economy in recession, Citibank report says. 23 July 1974
Financial leaders feel anxiety about the future of the economy. 4 August 1974.
Dow Jones Average hit 12 year low. 28, September 1974.
68% of people surveyed see the economy worsening. 29 September 1974.
So what should we do, buy or sell?
The answer is buy!
One month later, the market started a bull run for 13 straight years and gained 514%!
So let’s summarise lesson number one that we’ve learned.
Stocks are near the bottom when the economy goes into a recession. So whenever you see recessionary headlines, the economy’s getting worse and it’s time to get bullish and it’s time to buy stocks. But before buying stocks, I always wait for the technical analysis to confirm the reversal. For example, I look at the oversold conditions on the William’s Percentage R or extreme volatility from the normalised indicator or I see a change in the moving averages.
So never predict the reversal or predict the bottom. Always wait for the technical chance to confirm the reversal.
The other thing to be cautious about this, when I say buy stocks, I don’t mean buy all the stocks. There are good stocks and lousy stocks.
I mean to buy the index because the index always goes up in the long run, like the S&P 500 index or the Dow Jones index ETF, or you buy high quality companies that have got strong balance sheets and strong earnings.
Please avoid lousy companies with weak earnings and weak balance sheets because when you buy these stocks, they will not recover.
When the economy has fully recovered and you read all kinds of good economic news, be careful.
This means that stocks are near the top, so it’s time to get cautious and it’s time to start selling some of your stocks that are overvalued. Or you can buy put options like what I do to profit when the market begins to reverse into a correction.
Now, here’s the thing, you can’t always predict the exact top.
So, I always wait for the chance to confirm the reversals by look at the moving averages or the price action.
Let’s take a look at some examples.
News headlines in 2007:
Job growth strengthens economy. Spending and hiring rise while inflation eases. 2 June 2007.
S&P 500 tops 1,500 points on strong earnings. Index approaches its all time high. 4 May 200.
Economy manufacturing grows. 2 May 2007.
Rise in factory orders propels Dow Jones to new highs. 3 May 2007.
Great economy news right – so should we buy or sell?
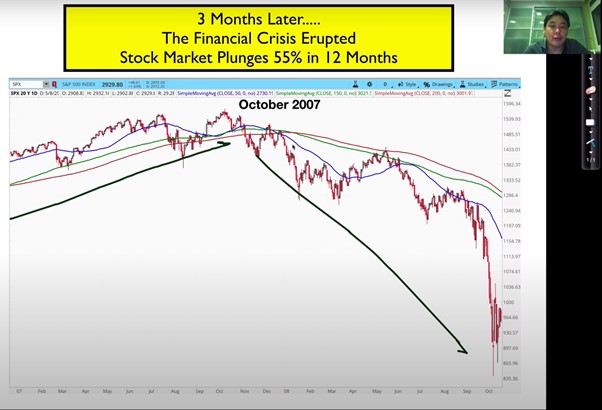
3 months later, the financial crisis erupted and the stock market plunges 55% in 12 months!
So just because you read good economic news does not mean you sell immediately, it does not mean you short the markets because you cannot predict exactly what’s going to happen.
Always wait for the charts to confirm the reversal.
So in this case, you can see that the reversal from the bull market to the bear market was nicely confirmed by the moving averages.
When the 50 moving average crosses below the 150 moving average (blue line crossing green line) and both of them sloping downwards – that is a technical reversal pattern.
At the same time, you can also see the price action where the market makes a high, lower high, lower high, lower high. When it makes four lower highs in a row, it is also a change in trend signal.
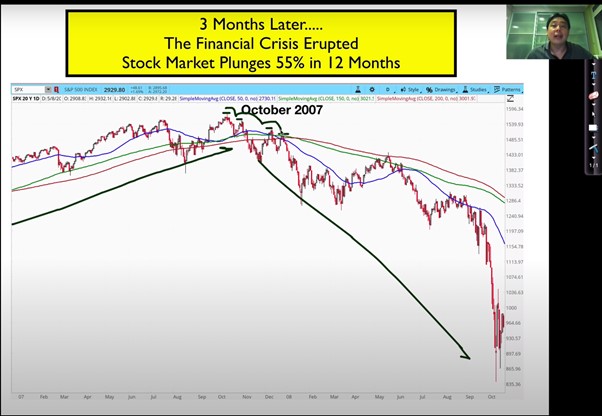
So that will be a time to sell stocks, to short the market or buy put options to protect your portfolio.
This is costly mistake number 1, there are 4 more mistakes to go and I’ll cover them in part 2 of this post!
May the markets be with you.

Leave a Reply
Want to join the discussion?Feel free to contribute!